Hourly Brent vs WTI: From Signal to Strategy
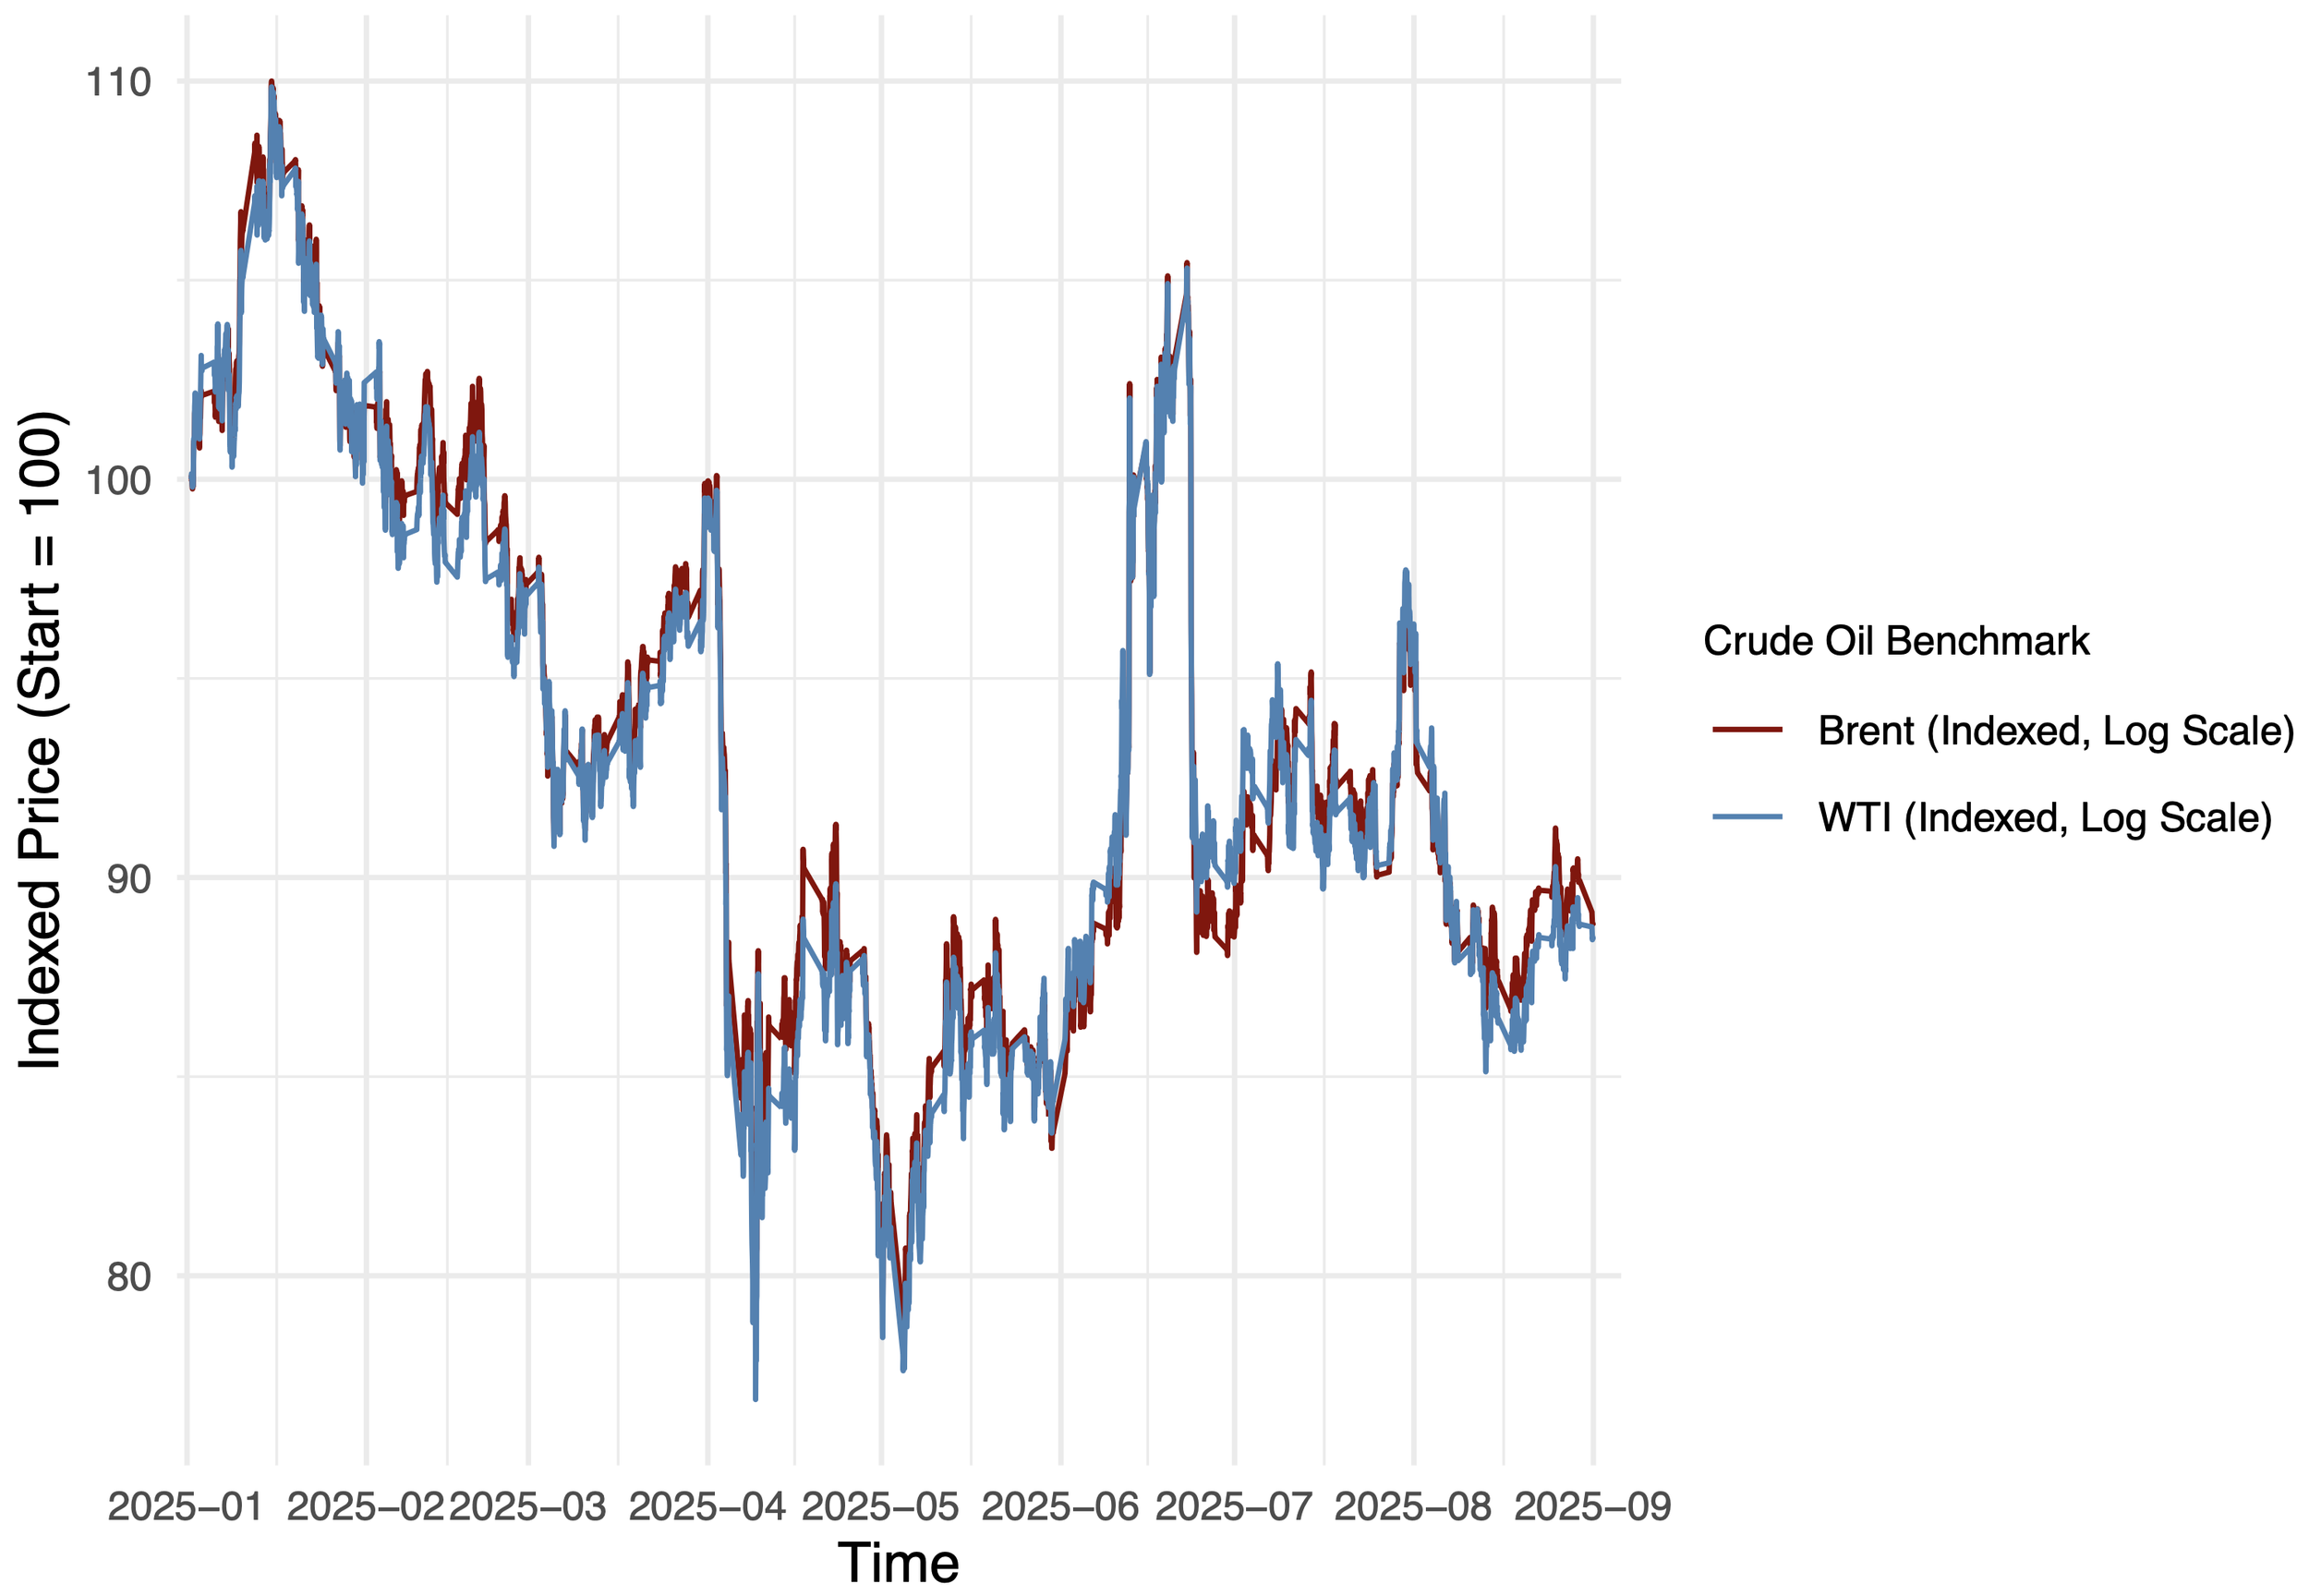
Crude oil is one of the cleanest real-world settings to test mean reversion. Brent and WTI track closely because they represent similar underlying commodities linked through global trade, refinery substitution, and physical arbitrage. When the relationship temporarily breaks down, the key question becomes: can you systematically identify those dislocations at an hourly frequency and convert them into a rule that survives realistic costs?
Thus, this project builds a state variable that flags when Brent is unusually “rich” or “cheap” relative to WTI, turns that signal into a transparent spread-trading strategy with auditable entries/exits, and then stress-tests the result with a simple robustness check.
Constructing a Mean-Reversion State Variable
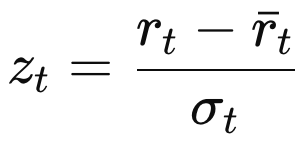
To quantify relative richness, I defined the Brent–WTI log ratio:

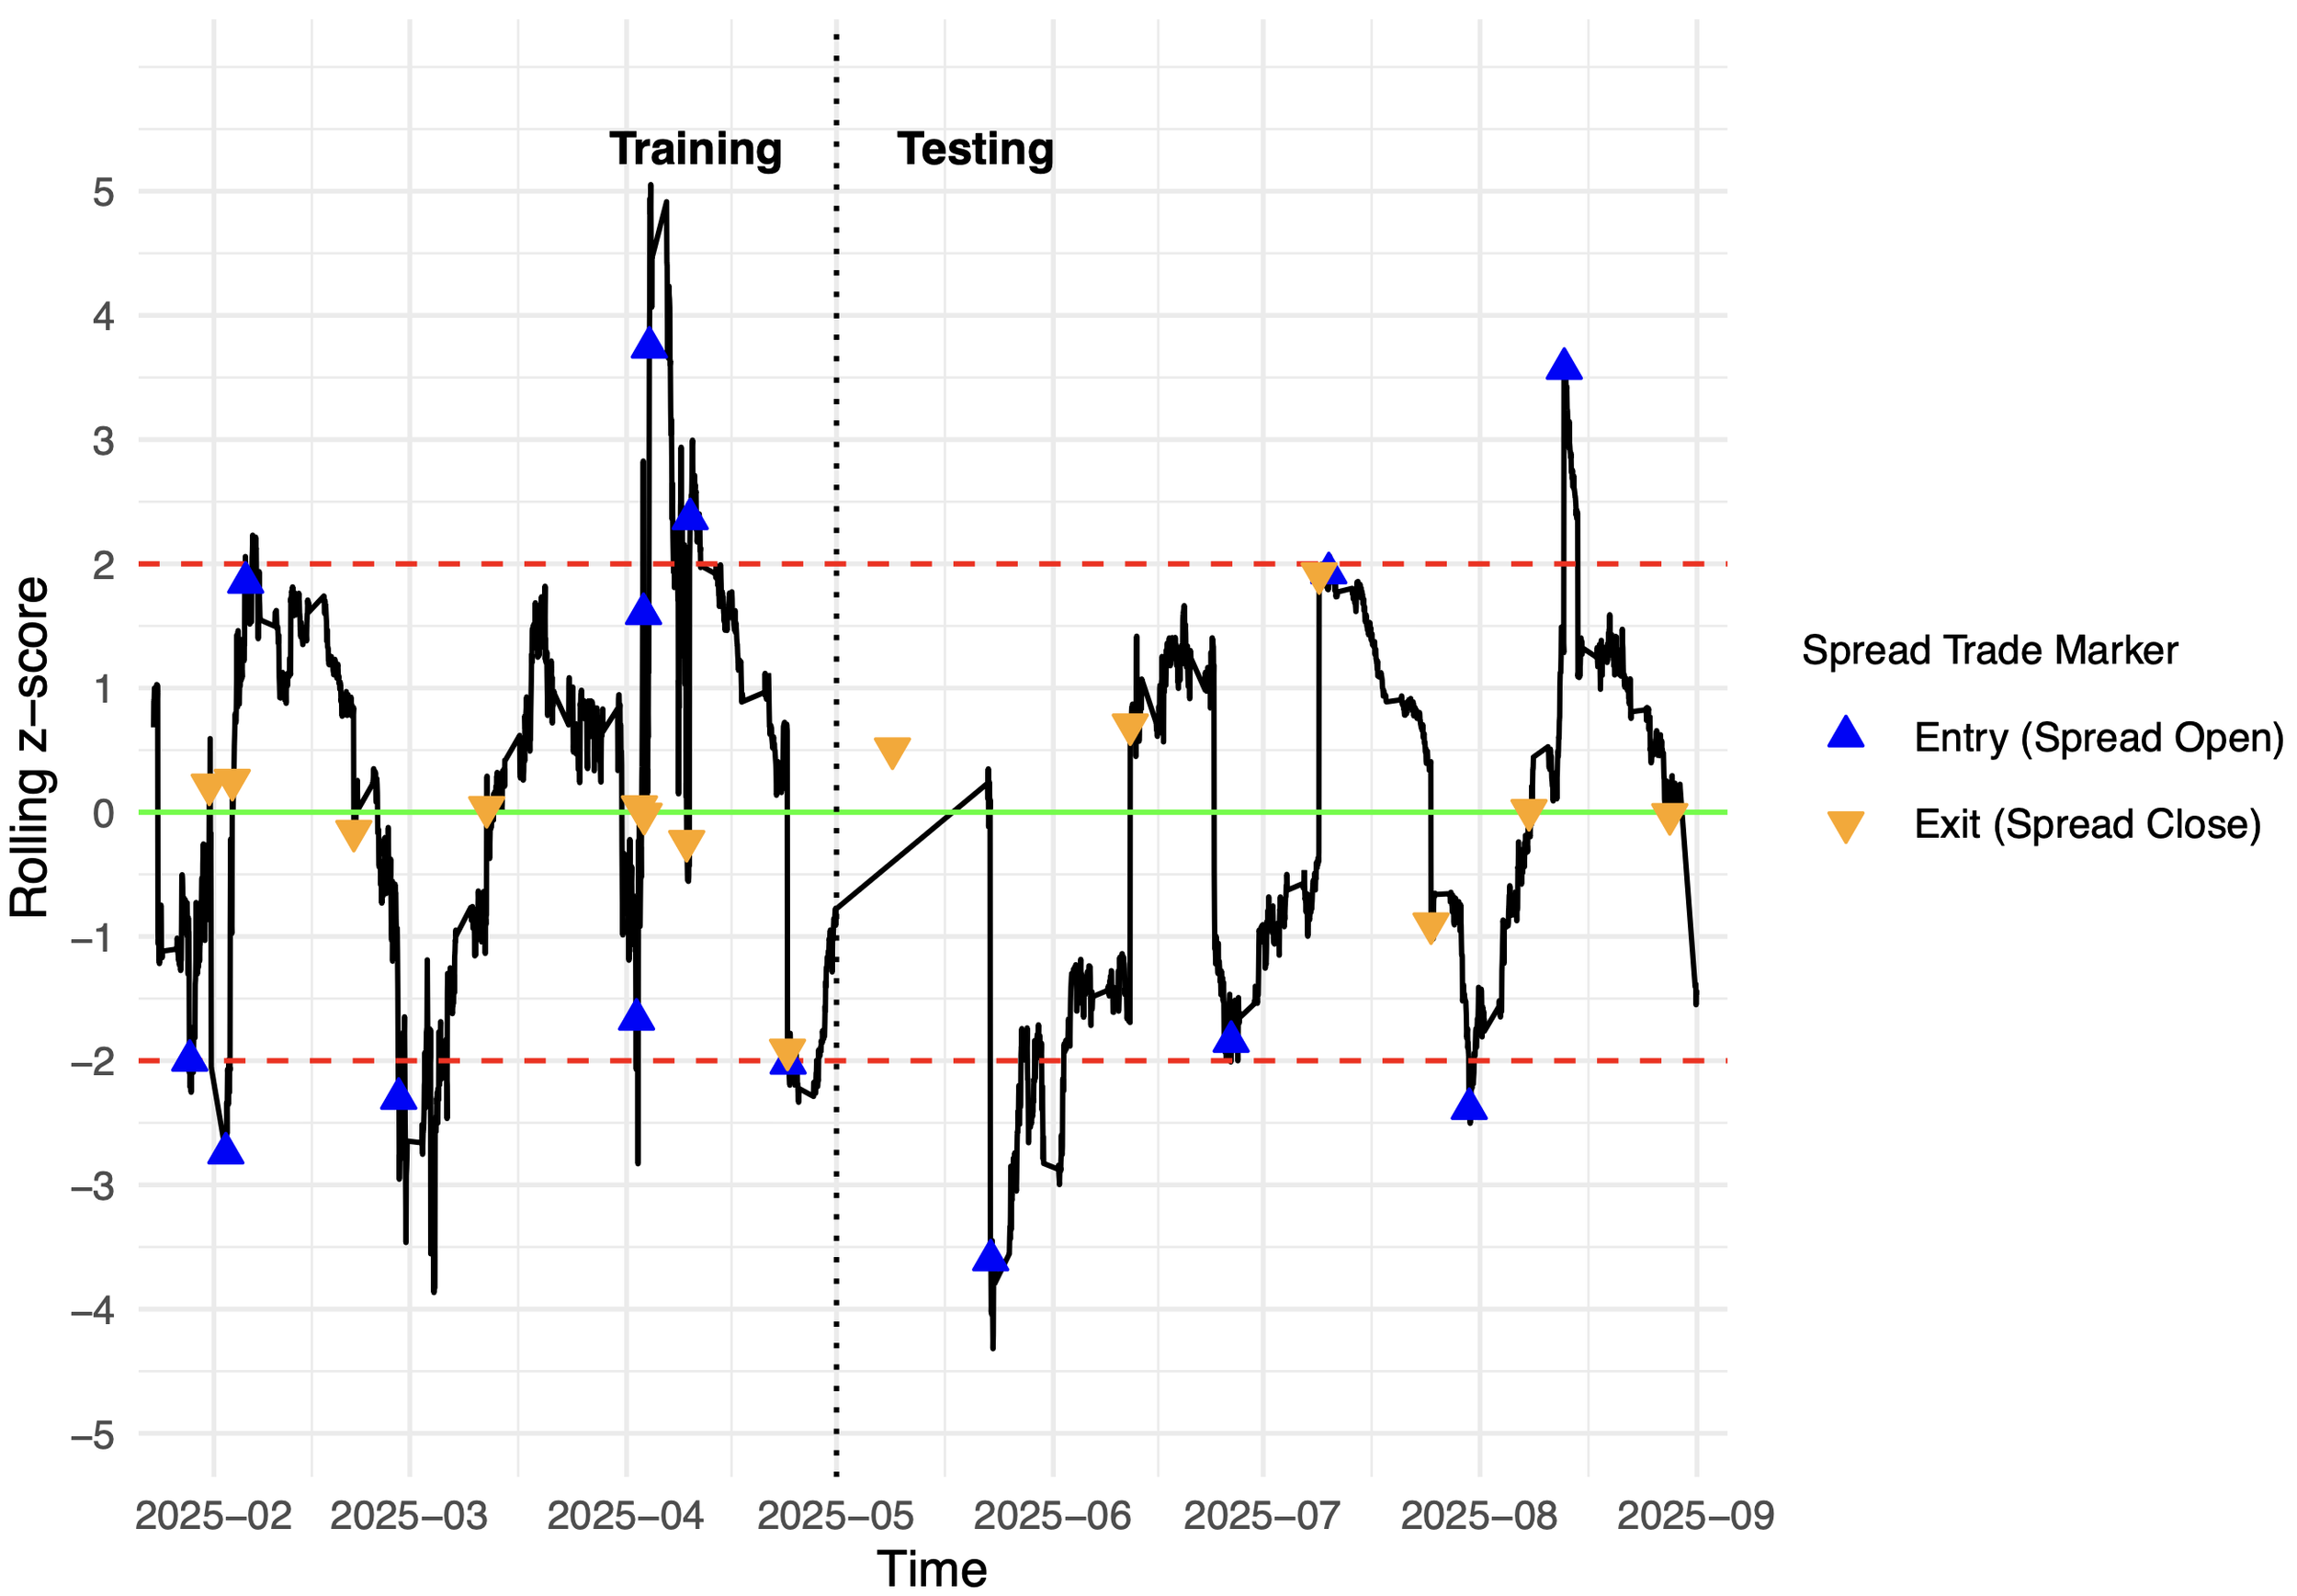
Using logs expresses deviations in percentage terms and avoids level effects. I then normalized this series using a rolling 15-day (360 hour) mean and standard deviation to form a rolling z-score:
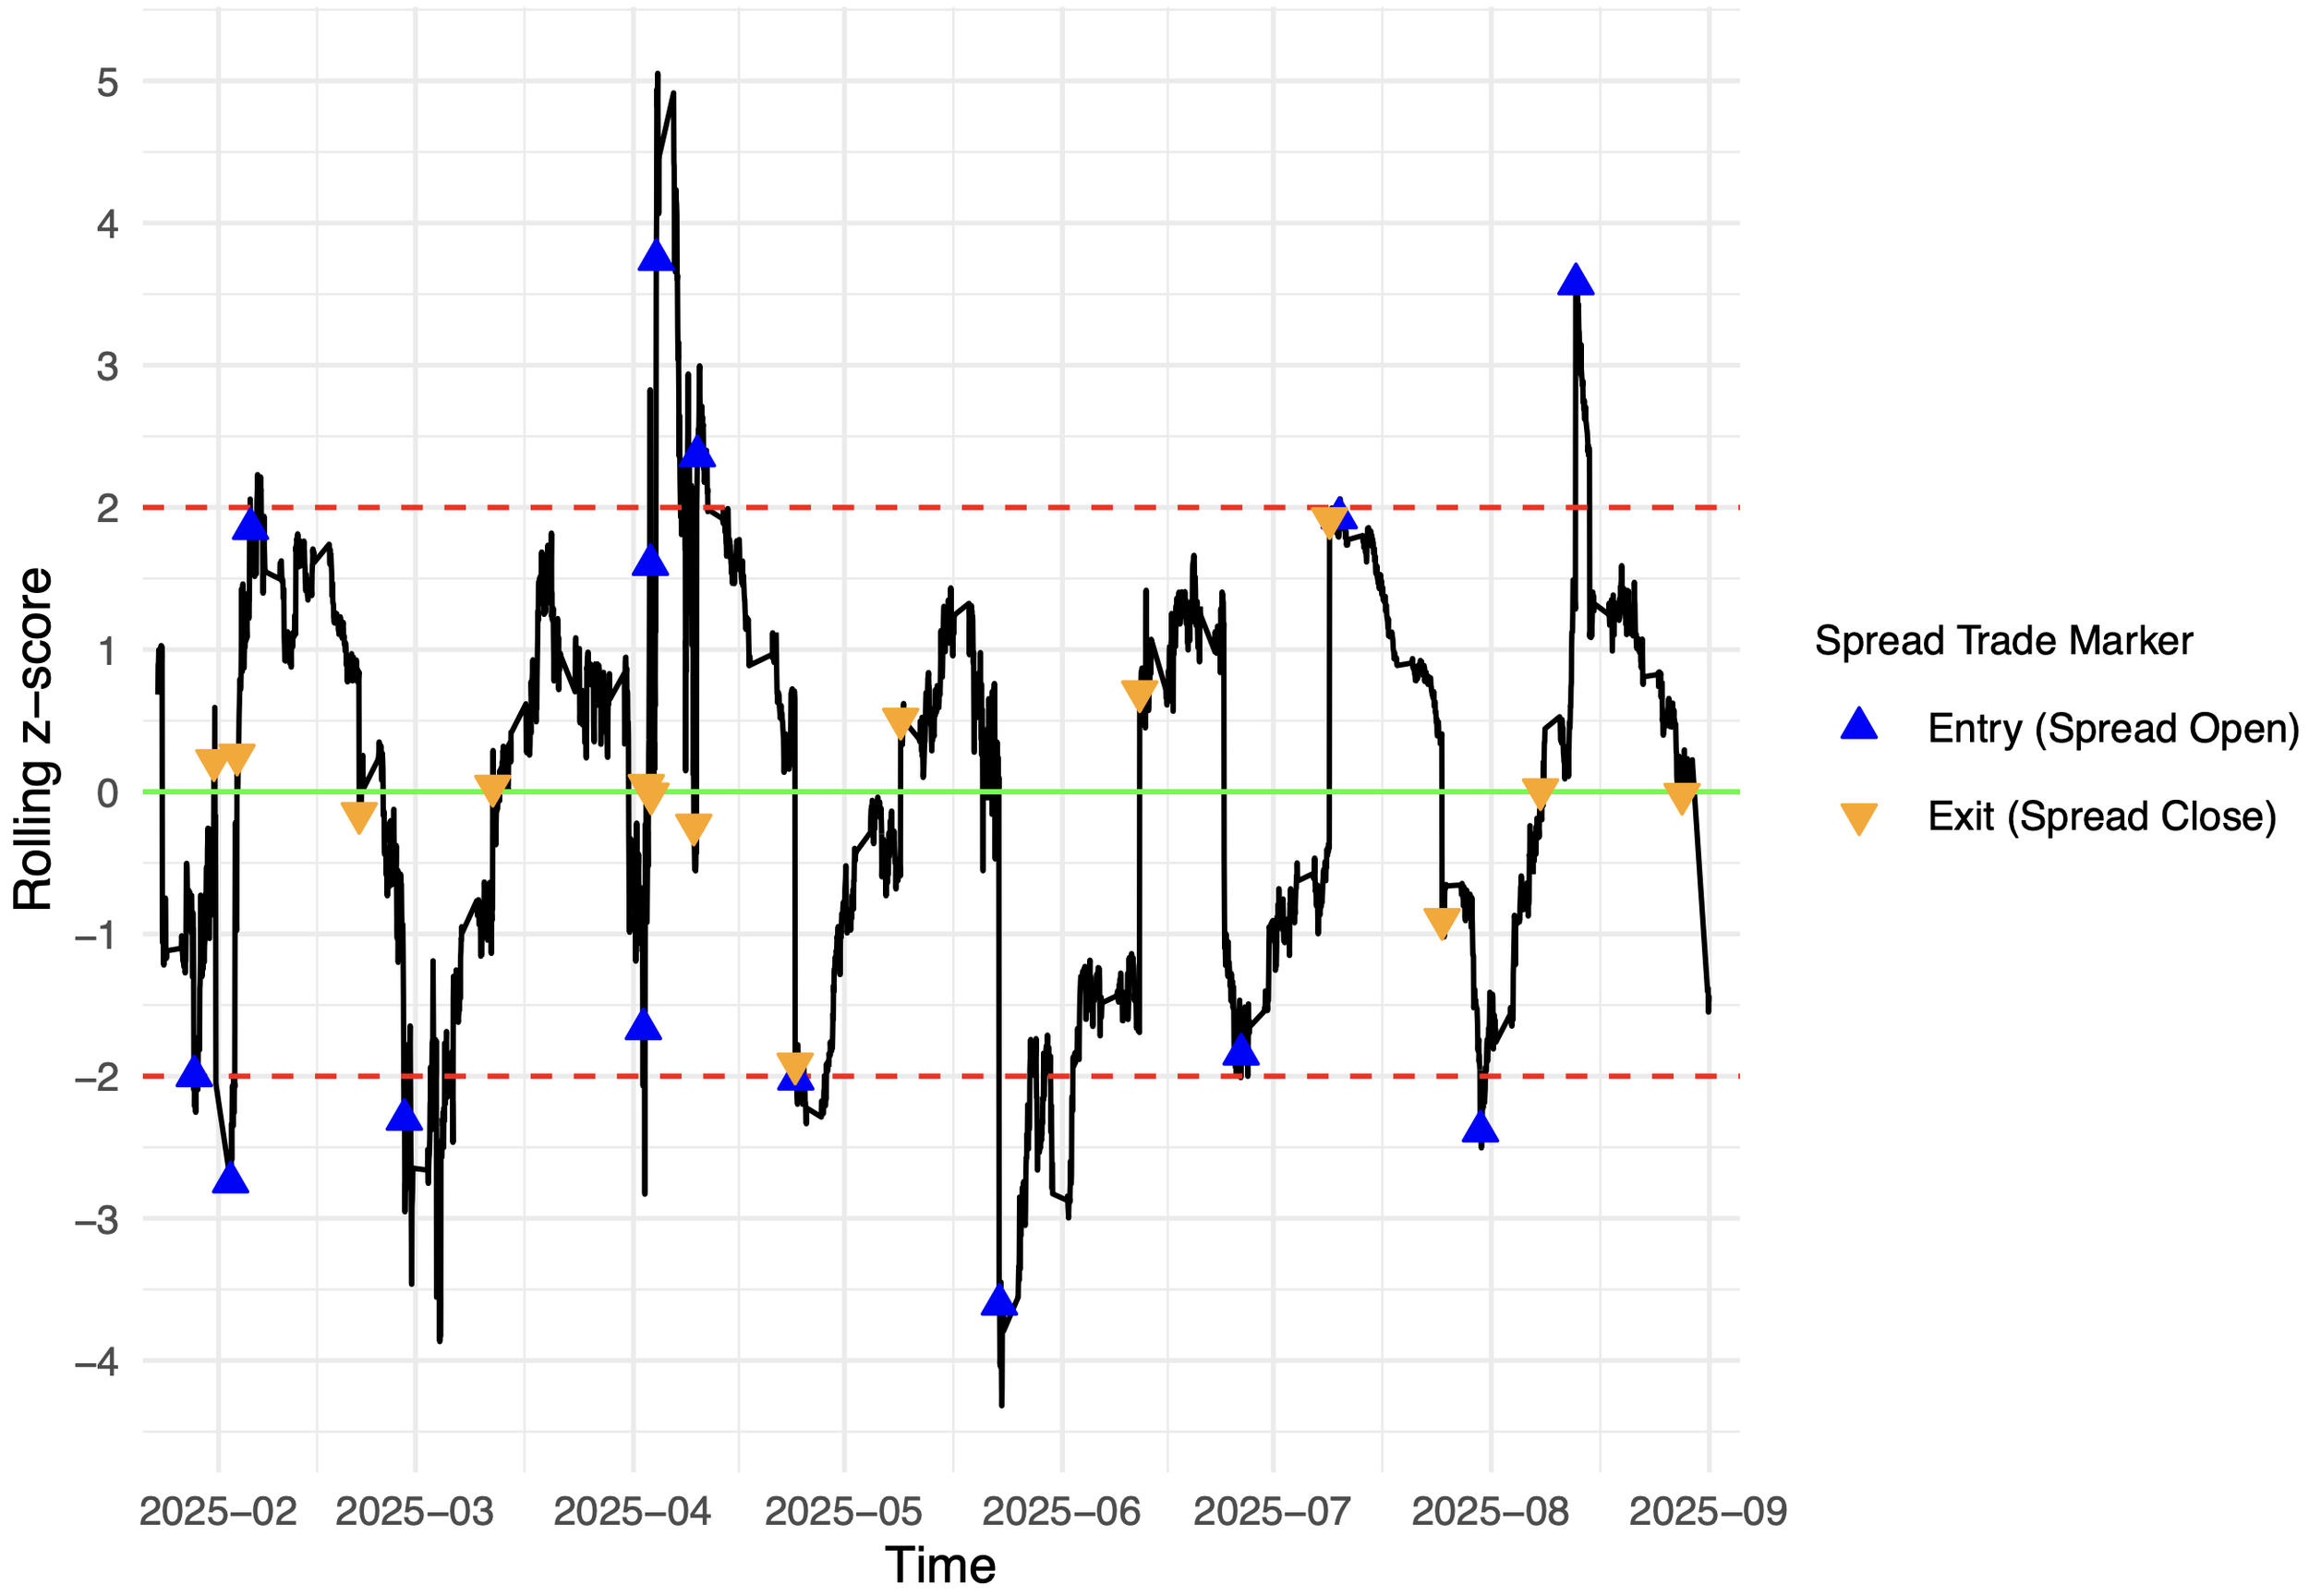
Values above +2 indicate Brent is unusually rich relative to WTI, and values below −2 indicate the opposite. The 15-day lookback was chosen to capture short-term micro-trends at the hourly horizon, rather than smoothing them away with a longer monthly window. The analysis window spans Jan 1, 2025 to Aug 31, 2025, selected because it highlights pronounced swings in the spread during that period.
From Signal to Trading Rule
With the state variable defined, the trading logic becomes mechanical:
Entry: open a spread trade when the z-score breaches an upper or lower threshold (tested at ±1.5, ±2.0, ±2.5).
Exit: close when the z-score mean-reverts back toward the center (near 0).
Implementation detail: apply a one-bar signal delay (to avoid look-ahead bias), and keep sizing symmetric so PnL maps cleanly to the relative move in the spread.
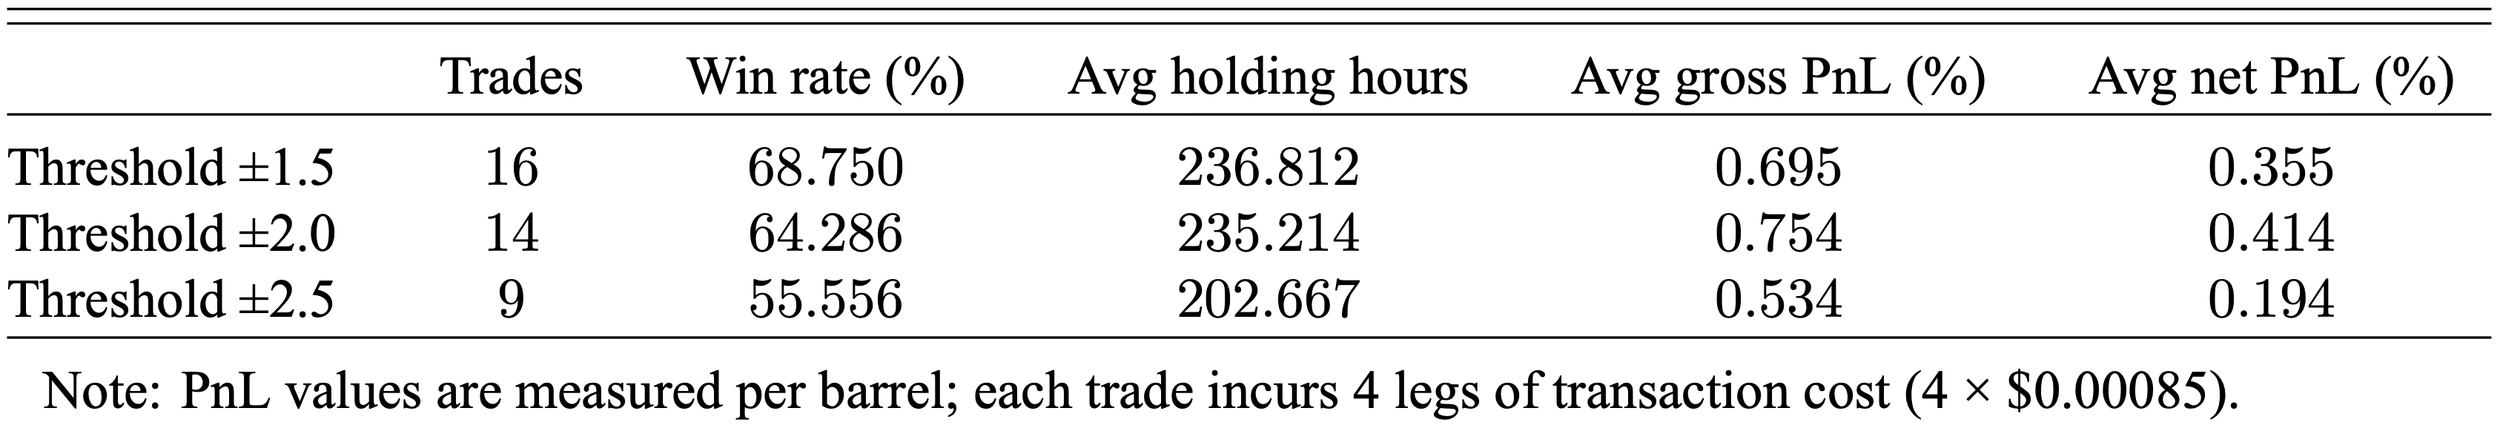
To keep results realistic, I applied transaction costs based on Interactive Brokers futures commissions: $0.85 per contract per leg. Since one contract represents 1,000 barrels, that’s $0.00085 per barrel per leg. A full spread round trip requires four legs (two to enter, two to exit), so total cost per trade is $0.0034 per barrel.
Results: Profitability After Costs
The strategy works best when it filters for economically meaningful dislocations rather than reacting to noise.
Across the tested grid, the ±2.0 threshold produced the strongest balance of selectivity and profitability: 14 trades, ~64% win rate, ~235 average holding hours, and ~0.414% average net PnL per trade (per barrel) after costs.
±1.5 triggered more trades and a slightly higher win rate, but net profitability was lower because smaller deviations are more noise-sensitive.
±2.5 was too conservative: fewer opportunities, lower win rate, and lower net PnL per trade over the sample.
The practical takeaway is that mean reversion exists, but only the larger dislocations are consistently worth paying costs to trade.
Robustness: Does it Survive Out-of-Sample?
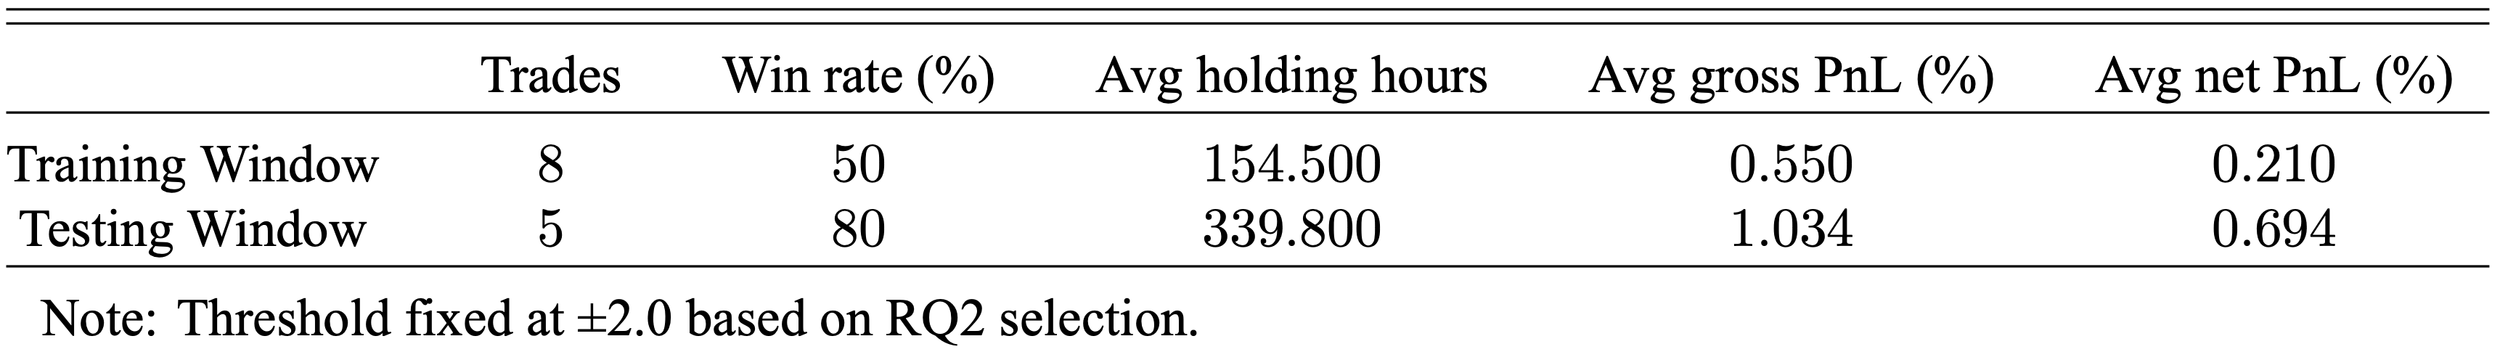
To test whether the result was just in-sample luck, I ran a train–test split:
Training: Jan 1 – Apr 30, 2025
Testing: May 1 – Aug 31, 2025
Threshold was fixed at ±2.0 (no re-tuning on the test segment).
The out-of-sample segment actually improved: 5 trades, 80% win rate, and ~0.694% average net PnL (with longer holds). That supports the conclusion that the signal is not purely an artifact of the initial evaluation window.
What This Project Demonstrates
This is a clean example of how to turn a market intuition into a research-grade workflow:
Define a state variable grounded in economic logic (relative price dislocations in linked benchmarks).
Translate the signal into rules with explicit entry/exit conditions and realistic implementation constraints (delay + costs).
Validate robustness with an out-of-sample test that avoids threshold overfitting.
Even in a highly efficient spread market, extreme divergences can revert strongly enough to clear transaction costs, but the edge is small per barrel, meaning real-world significance depends on scaling and risk controls rather than headline percentage returns.